

Your High School Teacher’s Fault?
If you are like me, then you memorized a plethora of formulas in high school, solved plenty of math problems, and moved on. Our teachers didn’t think much about the underlying concepts of the formula, so naturally, you and I didn’t either. Originally intending to write a new post on the base rate fallacy, it eventually led me down the deep rabbit hole of the fascinating branch of the mathematical world: Probability. What was supposed to be a simple logical fallacy revealed much deeper issues with my understanding than I had anticipated. Fast forward to the present, and I am literally having dreams about conditional probability and Bayes’ Theorem.
What Does This Mean?
Fasten your seat belts because this is going to be a long post about my week-long obsession with Bayes’ Theorem. I’ll explain everything that I have comprehended so far in as simple words as possible.
But first, I would like you to meet Steve. He’s a young man who dresses nicely and wears nerdy glasses. Now, who do you think Steve is more likely to be, a librarian or a farmer? And how sure are you about your answer?
If you guessed there’s a 90% chance (or some other absurdly high number) that Steve is a librarian, then congratulations! You are irrational!
But how could that be? His personality perfectly aligns with the stereotypical librarian. Umm…yes and no. Let me explain.
The nuance is that almost nobody tries to incorporate information about the ratio of librarians to farmers in their judgments. The ratio in the US is 1: 20 respectively. You might protest that how could one be expected to know such obscure information? You are not. But did you even think to consider a rough estimate? Probably not.
The Math Behind It
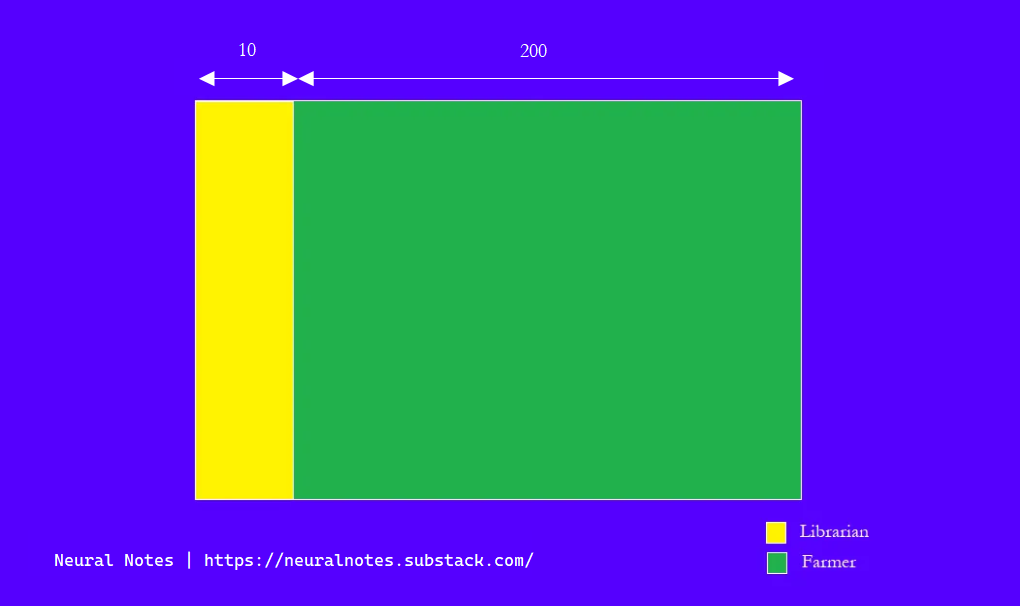
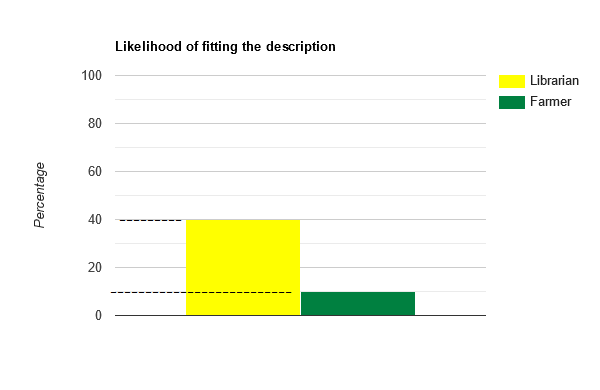
Let’s picture a representative sample of farmers and librarians. Until now, we know that Steve dresses nicely and wears glasses. Suppose a friend tells us that Steve is introverted and likes everything in order. Ah, this changes everything. Now we have even more evidence that Steve is likely to be a librarian. Let’s say you make a rough estimate that around 40% of librarians and 10% of farmers fit this new description.
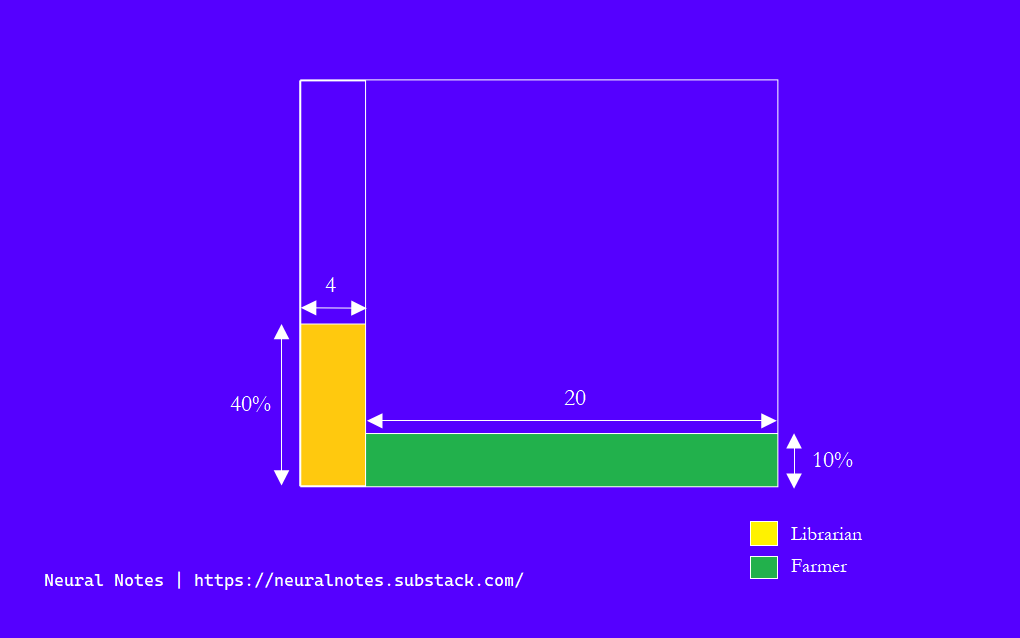
If those are your estimates, then it implies that there are around 4 librarians and 20 farmers who match this description. Therefore, the probability that a random person matches the description and is a librarian is 4 / (4 + 20) or ≈ 16.7 %. This is way less than what we had originally predicted. So, even if you think that a librarian is 4x more likely than a farmer to fit the description, this does not overcome the fact that there are just more farmers than there are librarians. This is the underlying principle of the Base Rate Fallacy. We overestimate the likelihood of an event based on individuating information and ignore the base rate. For instance, up to 90% of startups fail in less than 5 years. Yet, we think our startup will be different. We ignore the base rate and assign greater value to cases with specific information.
The heart of Bayes’ Theorem is that new information does not define our beliefs in a vacuum; rather, it should update our prior beliefs.
Seeing evidence restricts the total possibilities. Putting it all together mathematically, we can see it as follows:
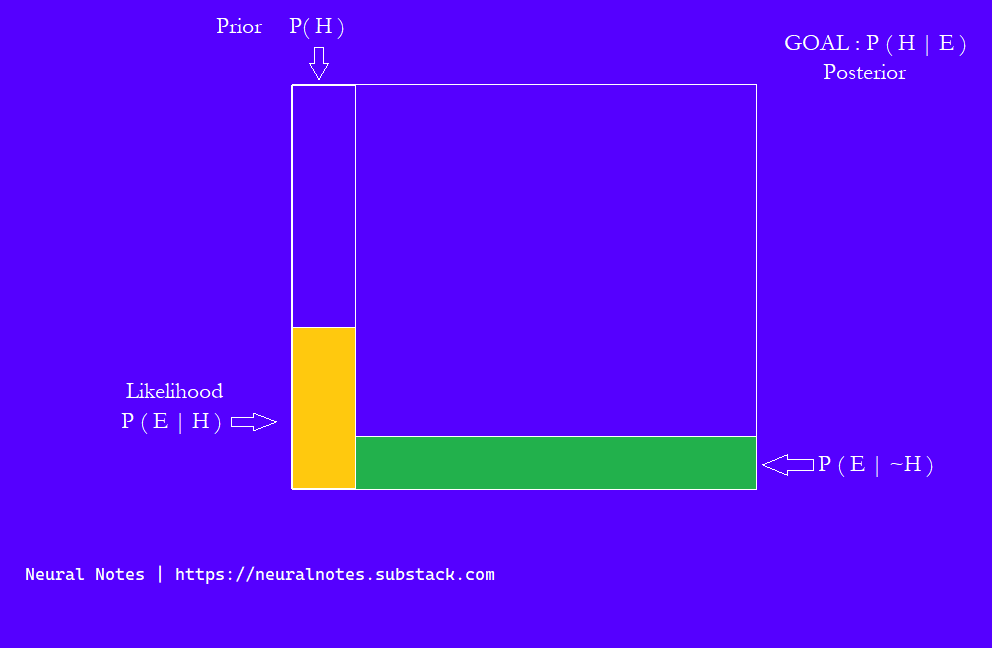
Here, P ( H ) is the probability of our hypothesis being true before any new evidence. This is called the Prior.
Then we observe some new evidence, that is, the description of Steve’s personality.
The introverted and order-friendly description fits the typical stereotype of a librarian. Librarians are indeed obsessed with order and are generally shy. Based on this new evidence, we are a little more confident than before that Steve must be a librarian. So, in this new scenario, what is the probability that our hypothesis of Steve being a librarian is true in light of the evidence? Mind you, the evidence is correct. This is P ( H | E )
Let's say that Steve is, in fact, a librarian and also fits the description. Now, what is the probability of us seeing this evidence in the real world? How often do we see people who fit the description also working as a librarian? That's P ( E | H )
The probability that our librarian hypothesis is true given that the evidence is true = (Total number of librarians fitting the evidence / Total number of people fitting the evidence)
P (H|E) = {P(E|H) × P(H)} ÷ P(E)}
Bayesian Thinking
Bayes' Theorem helps us update our beliefs or predictions about something based on new information. It takes into account what we already know and how strongly the new information supports or contradicts our beliefs. By doing so, it allows us to make more accurate predictions and decisions under uncertainty.
Wider Implications - An Example
Suppose there's a disease that is very rare, affecting only 1 in 1000 people. You get tested for the disease, and the test is very accurate - it only gives false positives (saying you have the disease when you don't) in 1% of cases.
If your test comes back positive, you might think it's very likely that you have the disease. Actually, even with a very accurate test, there's still a 90% chance that you don't have the disease.
Rare Disease X affects 0.1% of the population (P(X) = 1/1000 = 0.001)
The test is 99% accurate, meaning that P( + | X ) = 0.99 and P( + | ~X ) = 0.01
If the test comes back positive, we want to know P( X | + )
We can calculate P( X | + ) using Bayes' theorem:
P(X|+) = P(+|X) * P(X) / { P(+|X) * P(X) + P(+|~X ) * P(~X) }
= 0.99 * 0.001 / [0.99 * 0.001 + 0.01 * 0.999] ≈ 0.090
Therefore, if the test comes back positive, there's about a 9% chance that you actually have Rare Disease X. So just because a test says you have a disease, it doesn't mean you definitely have it—especially if the disease is very rare. The accuracy of the test and the prevalence of the disease both matter in determining how likely it is that you actually have the disease.
Bae’s Theorem 😉
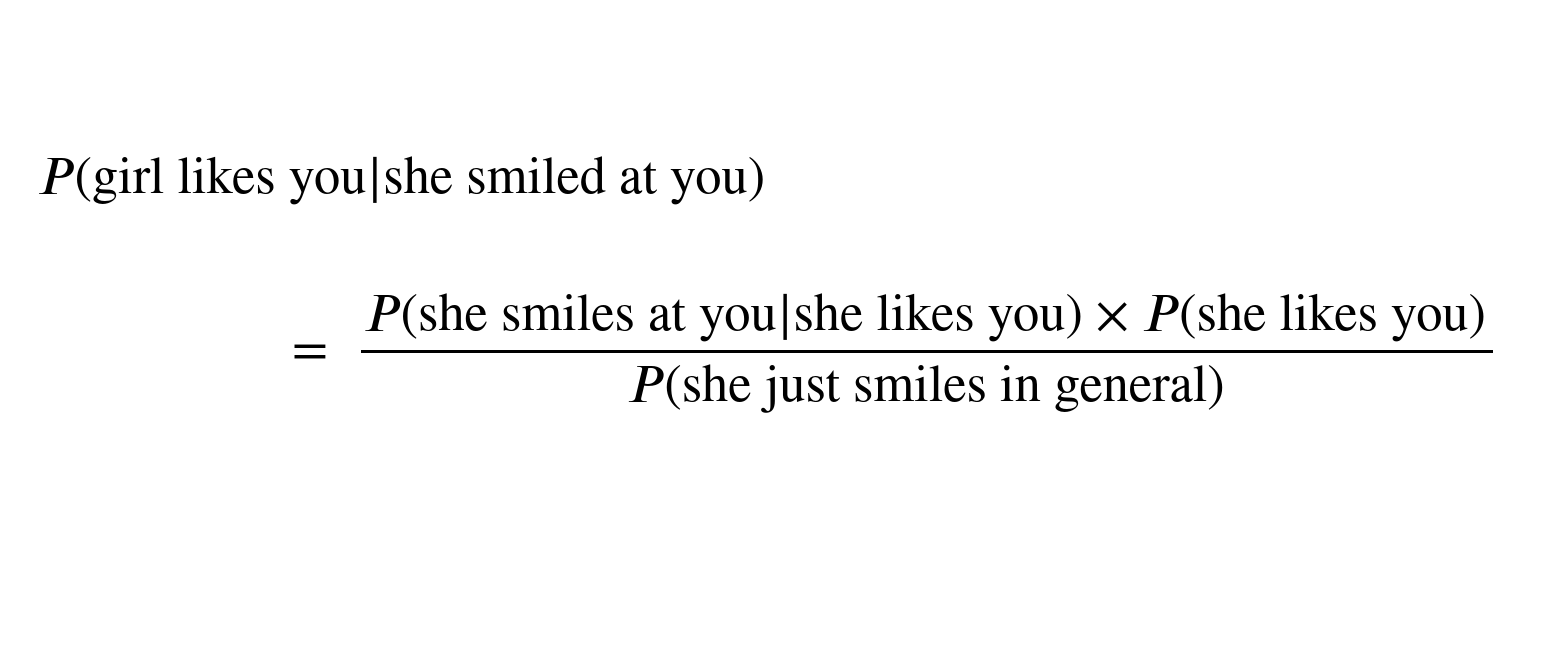
If it wasn’t clear before, I bet it is now!